Nov 2026
Recording every new token forward, pre-registering every rule, and a real-money post-mortem that blamed the safety stops, not the strategy.
Quant, Research, Crypto, Python, Next.js
New to some of the terms? See the glossary at the end.
Banks don’t just build credit models; they argue about them. Before a model is allowed to decide who gets a loan, a separate validation team tries to break it: does it still work on loans made after it was built, are its numbers right as well as its rankings, would anyone notice if it started going wrong?
I wanted to do the whole thing properly, start to finish, so I built a credit model the way a bank would and then reviewed it the way a validation team would. I used Lending Club’s public loan book: 620,783 three-year loans made between 2007 and 2015, every one of them old enough that we know how it ended.
The most useful thing it taught me wasn’t about the model. For two years the loans got steadily worse, and the standard health check said everything was fine. If you want every method and number, the full write-up is a model document laid out like the ones bank validators review.
Lending Club is a useful dataset because it’s big and dated, so you can build a model on one period and test it on the next, which is how a bank would actually use it. (The other popular public dataset, Home Credit, has no dates, so you can’t.) But it comes with traps, so I set some rules first.
One data quirk shaped everything. Lending Club started recording sixteen credit bureau fields (total credit limits, credit card usage, recently opened accounts) only in late 2012. So the models are built on loans from October 2012 to December 2013, and tested on what came after: 2014 and 2015.
The first is a scorecard, the model banks have used for decades and regulators still expect to see. Each characteristic, such as credit score or debt-to-income ratio, is cut into bands; each band is worth some points; the points add up to a score. Mine ended up with ten characteristics. You can print it on one page and explain any decision with it.
The second is LightGBM, a machine-learning method that builds hundreds of small decision trees. It gets all 40 characteristics and can find patterns a scorecard can’t. I made it keep the common-sense directions (a higher credit score can never make you look riskier), but it’s still much harder to explain.
The usual measure is the Gini: how well a model puts the borrowers who end up defaulting above the ones who don’t. Here’s how they did on loans from the build period, and on the two years after.
| Gini | Same period (held out) | 2014 loans | 2015 loans |
|---|---|---|---|
| Scorecard | 0.310 | 0.316 | 0.330 |
| LightGBM | 0.352 | 0.354 | 0.363 |
| Lending Club’s own grade | 0.277 | 0.319 | 0.357 |
Neither model got worse at ranking out of time; if anything, both got slightly better. That’s the reassuring part, and many projects stop there.
One quiet surprise: Lending Club’s own grade started out worse than my simple scorecard, then improved steadily until it matched LightGBM. They had information I didn’t and kept rebuilding their model as data piled up. Mine was frozen in 2013.
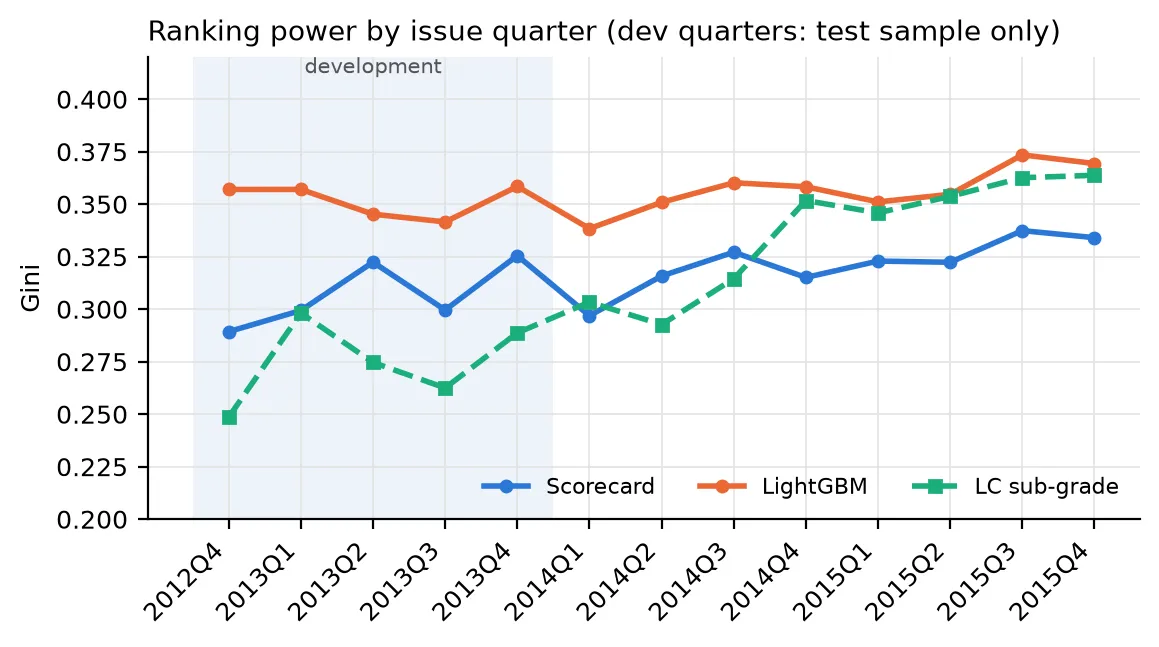
Ranking power by the quarter the loans were made.
Ranking is only half the job. A bank also needs the predicted default rates to be right: if the model says 10% and the truth is 15%, everything built on top (pricing, provisions, capital) is wrong too.
Here’s the problem, in Lending Club’s own grades.
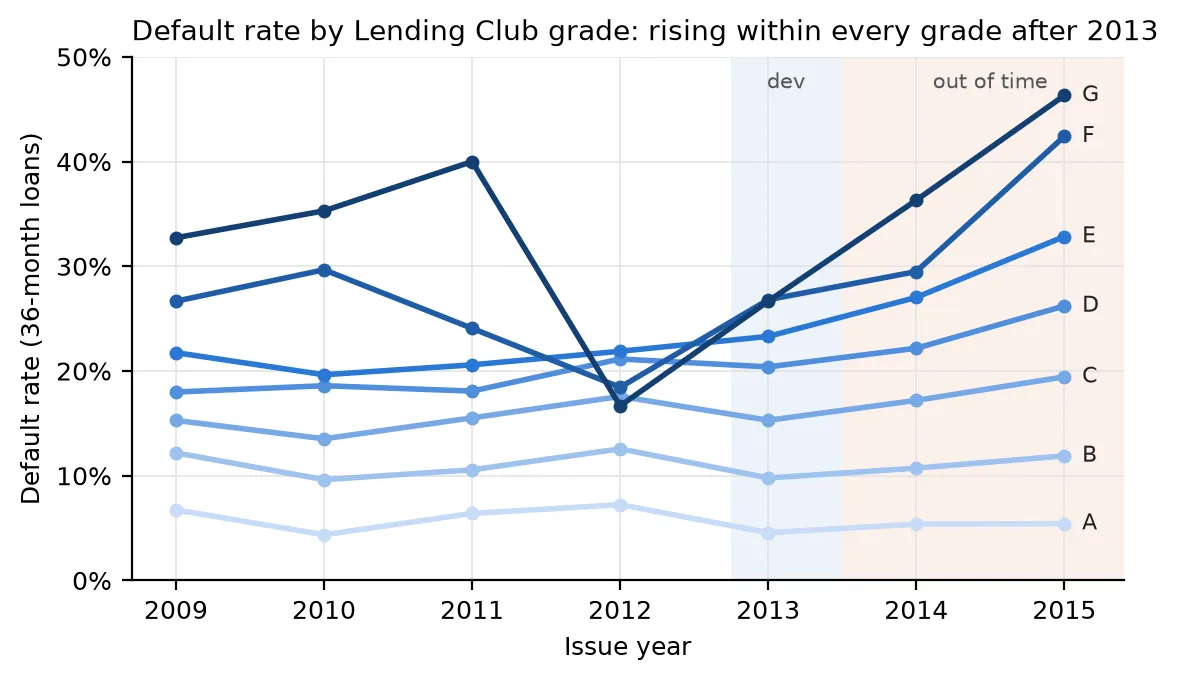
Default rate by Lending Club grade and the year the loans were made.
From 2013 on, the default rate rises inside every grade. For C-grade loans it went from 15% to 19%; for E-grade, from 23% to 33%. The same kind of borrower, as Lending Club itself judged them, was defaulting more and more often.
My models saw the same thing. They predicted that about 13% of the 2015 loans would default (12.9% for the scorecard, 13.3% for LightGBM). 14.9% did. On the model’s own rating scale, a standard test (the one European supervisors use) rejects the predicted default rate in seven of the eight grades.
With hundreds of thousands of loans, though, that test rejects even tiny misses, so the more useful number is the size of the miss. In 2014 the failing grades defaulted 5–10% more than predicted: real, but small enough that many banks would just keep an eye on it. In 2015 it was 9–21% more, worst in the middle of the scale where most of the loans sit. That one matters.
This is the part I’d want every model owner to see.
The standard way to monitor a credit model is the population stability index (PSI). Each month you check whether new applicants look like the ones the model was built on: same mix of credit scores, incomes, debts. Below 0.1 is green, and nobody worries.
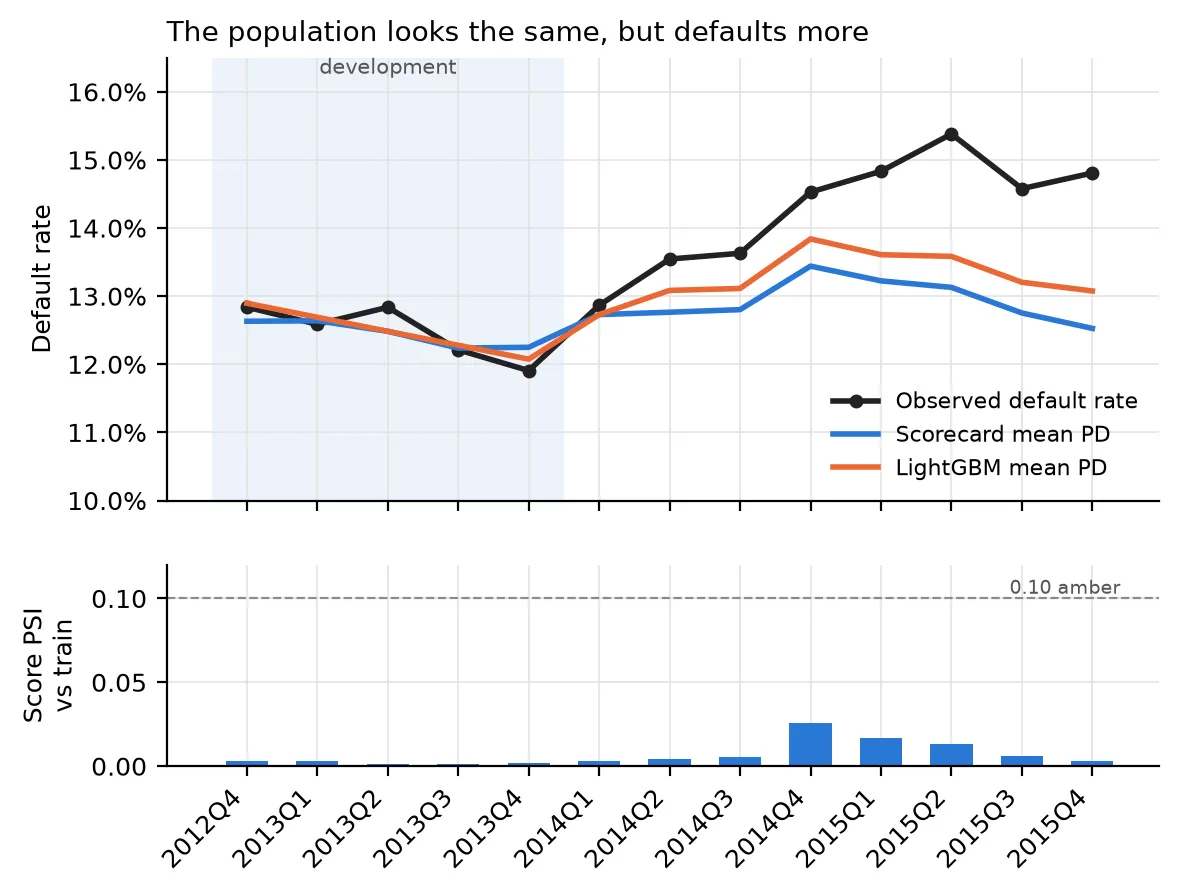
Top: what the models predicted for each quarter’s loans, and what actually happened. Bottom: the stability index, checked against the applicants the model was built on.
The PSI never went above 0.03. Not one quarter came anywhere near amber. I checked every characteristic separately too, and all but one were green. The exception was income verification, which wasn’t in the scorecard; Lending Club had changed how it checked incomes.
The applicants looked the same on paper. They just defaulted more often. PSI only looks at who is applying, not at what happens to them afterwards, so by its nature it can’t see this kind of drift. A bank watching only that dashboard would have reported a healthy model throughout 2014 and 2015 while losses ran ahead of plan.
So what changed? Not the economy: US unemployment fell from 7.4% in 2013 to 5.3% in 2015. It looks like Lending Club itself:
In other words, this was drift in who Lending Club lent to, not in the economy. That actually makes it a sharper warning: it’s the kind of drift a lender creates for itself when it chases growth.
The catch is that these are three-year loans. You don’t know for sure how a 2015 loan ends until 2018. So the fix I recommend in the write-up is to watch early arrears, meaning loans 30 days late six months after they’re made, against what the model expected. That signal arrives years sooner.
When ranking holds but the level is off, the standard fix is to shift every prediction up by the same amount. To test it honestly, I did what a bank would at an annual review: I measured the shift on 2014 loans, the latest full year, and applied it to 2015.
It helped, but only about a third as much as needed. The prediction went from 12.9% to 13.6%, against 14.9% observed, and six of the eight grades still failed the test. 2015 was worse than 2014, so a fix sized on last year was already behind. Things were moving faster than the calendar.
The last step turns default rates into money. Expected loss is three numbers multiplied together: the chance a loan defaults, how much is still owed when it does, and how much of that is never recovered.
The data gives all three. A defaulting borrower still owes about 58% of the original loan on average, since they’ve been paying it down for a while. And Lending Club gets back very little: about 89% of what’s owed is lost, which is normal for unsecured debt sold to collection agencies.
For a stress test I asked: what would a repeat of 2007–2009 do? I took the crisis-era loans, gave each one the default rate that borrowers like them had in my build period, and measured how much higher their real default rate was. That isolates the downturn itself from changes in who was borrowing. Then I applied it to the 2015 loans.
The catch is the word “like”. My first version matched borrowers on Lending Club’s own sub-grade. But Finding 2 shows that what a grade meant kept changing, and the 2007–09 loans came from a young platform grading on a different model. In fact, at the same credit score, crisis-era borrowers got grades one to six notches worse than in 2012–13. Matching on grade therefore made the crisis look milder than it was. Matching on credit score and debt-to-income, which mean the same thing in any year, gives a much harsher answer:
| 2015 loans ($3.6 billion) | Predicted loss |
|---|---|
| Normal conditions | 6.6% |
| Crisis, matched on Lending Club grade | 8.1% |
| Crisis, matched on credit score and debt-to-income | 11.4% |
| What actually happened | 7.6% |
The truth is probably somewhere in between, and a bank planning capital should take the harsher number. My first version of this post said 2015 lived through “most of a crisis”. That only holds on the grade-based number. On the score-based one, 2015 went about a fifth of the way. Either way, the extra loss came from Lending Club’s own lending, not from a recession.
For completeness I also ran the Basel formula regulators use to set how much capital a bank must hold. It comes out at about 10% of the amount lent, which is roughly where you’d expect for this kind of lending.
LightGBM beats the scorecard by about four Gini points everywhere. What does that mean in money?
Suppose you turn down the riskiest 20% of applicants. In 2015, LightGBM’s rejections would have avoided 628 more defaults than the scorecard’s. At about $6,500 lost per default, that’s roughly $4 million on $3.6 billion of loans. Not trivial.
The cost is explanation. A US lender has to tell a declined applicant the main reasons. For the riskiest fifth of borrowers, the top reason LightGBM would give matched the scorecard’s only 29% of the time, and 15% of the time it was a characteristic the scorecard doesn’t even use.
That turned out to be mostly an accounting problem. LightGBM spreads the blame across overlapping credit-bureau fields: total credit limit, card limit and revolving limit all say roughly the same thing. Nobody would tell an applicant which of the three it was; they’d say “limited available credit”. So I grouped the fields into eight families like that one and compared again. Agreement on the top reason jumped from 29% to 75%, and the scorecard’s top reason was in LightGBM’s top three 93% of the time.
My recommendation is still the boring one: keep the scorecard in charge, run LightGBM alongside it, and promote it if the gap holds. But the explanation problem now looks solvable rather than fundamental.
A few mistakes are worth owning, because they’re exactly what a validator looks for. The last two were pointed out in a review after the first version of this post went up.
It’s all Python: a pipeline from the raw 1.7 GB file to every table and chart, behind a
single reproduce command, with tests for the statistics. The code is
on GitHub, and the model document has the full
validation, including the findings log and the limits of what this data can tell us.