Nov 2026
Recording every new token forward, pre-registering every rule, and a real-money post-mortem that blamed the safety stops, not the strategy.
Quant, Research, Crypto, Python, Next.js
New to some of the terms? See the glossary at the end.
A YouTube video shared with me this week tested a day-trading strategy credited to trader Fabio Valentini, and it was the rare one that survived. The presenter, a self-described former market maker, had taken several popular retail strategies through what he called an institutional testing process. Most fell apart. This one didn’t.
The rules are simple, which is a good sign:
Over 2021 to 2026, the video reported 846 trades, a 58% win rate, a profit factor of 1.33 and $181,000 of net profit on one contract, with a worst drawdown of $25,300. That’s about $7.20 of profit for every dollar of drawdown.
Then it made two improvements. It dropped an order-flow filter (“delta”), because the filter added nothing in the first half of the sample. And it sized each trade to risk the same dollar amount instead of trading one contract every time, citing research on volatility management. Profit went from $170,000 to $317,000, and profit per dollar of drawdown rose to 8.7.
I liked the process. But five years is a short test for a strategy that only ever buys. So I tested it twice: first on 2010 to 2022, with everything from 2023 onwards sealed, and then, once I’d seen the first result, on the sealed years.
The video grounds the strategy in a real paper: Gao, Han, Li and Zhou (Journal of Financial Economics, 2018) found that the S&P 500’s return through the first half-hour predicts its last half-hour, 15:30 to 16:00. This strategy is closed by 15:00, so it never holds the half-hour where that effect lives. I’d also already tested that effect on the indices for 2014 to 2022, for an earlier post, and it was gone.
The first improvement has good support. Cont, Kukanov and Stoikov (Journal of Financial Econometrics, 2014) showed that order-flow imbalance mostly explains the price move in the same interval. A candle that closes strongly above the range has almost certainly had buyers behind it already, so a delta filter is mostly repeating the candle. Dropping it was right.
The second is weaker. The paper cited, Moreira and Muir (Journal of Finance, 2017), scales exposure by last month’s volatility, not by the distance to a same-day stop. And when Cederburg, O’Doherty, Wang and Yan (Journal of Financial Economics, 2020) tried implementable versions on 103 portfolios, they usually did worse than the unscaled originals.
Before each test I wrote the rules, costs and pass marks down and committed them, so the result couldn’t change them afterwards.
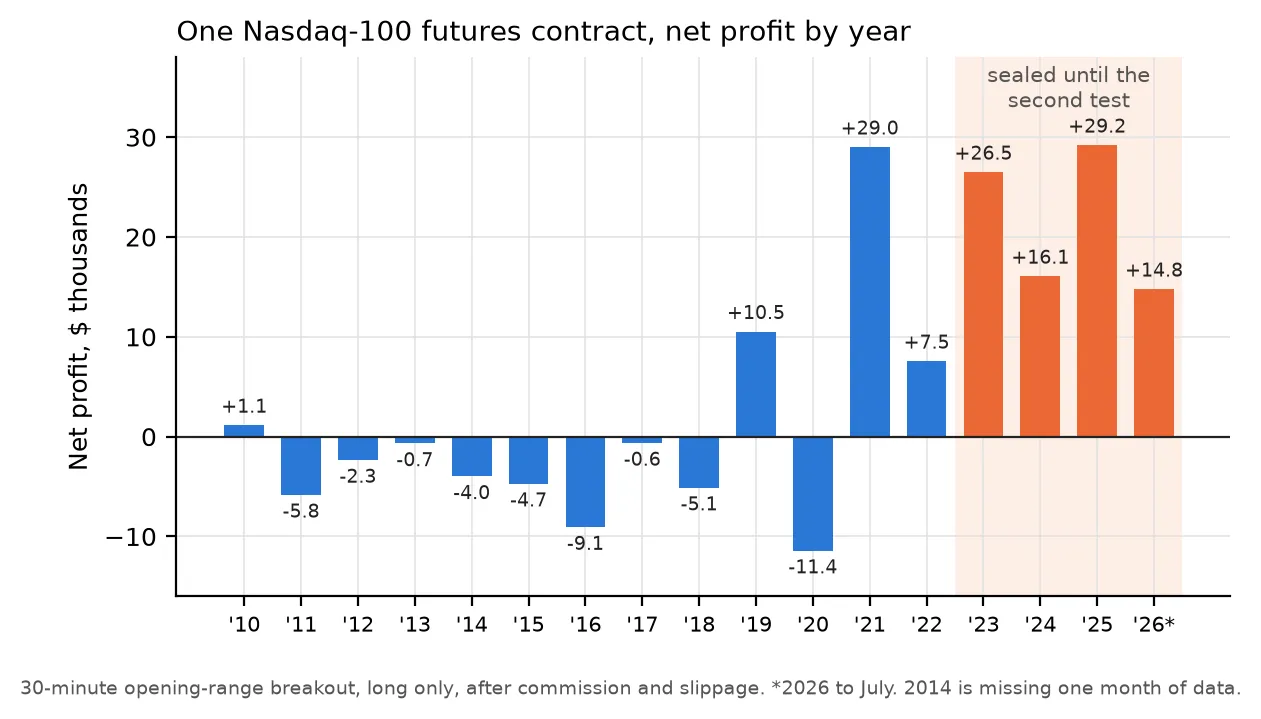
Net profit per year on one Nasdaq-100 futures contract, after costs. Orange years stayed sealed until the second test.
The first check was whether I’d reproduced the strategy, and I had. In 2021 one contract made $29,000, winning 61% of its trades, close to the video’s pace of about $34,000 a year. 2021 and 2022 together made $36,550.
Before that, it lost. From 2010 to 2018 the same rules lost $31,195, winning 49% of trades, and lost money in eight of those nine years. The video noted that profit per trade was “much smaller” back to 2015; in my test, 2015 to 2018 alone lost $19,510.
Over the 13 years, one contract made $4,455, with a worst drawdown of $45,175: 10 cents of profit per dollar of drawdown, against the video’s $7.20. The profit factor was 1.01, which is break-even. Measured in returns, it lost money:
| 2010 to 2022 | Sharpe before costs | Sharpe after costs | Max drawdown |
|---|---|---|---|
| Breakout, fixed size | 0.10 | −0.27 | 41.8% |
| Breakout, fixed risk per trade | 0.30 | −0.26 | 30.1% |
| Long the Nasdaq every day, 10:00 to 15:00 | 0.23 | −0.15 | 33.2% |
There was almost nothing to work with before costs, and costs weighed most in the early years: the same cost of up to 0.75 index points a trade was 3.75 basis points when the index was at 2,000, but under half a basis point at 16,000.
Partly, it was just being long. 55% of trades ended at the 15:00 cut-off, simply holding the Nasdaq through the afternoon. Against being long every day from 10:00 to 15:00, its beta was 0.30 (t = 7.1), and what was left over was −11 basis points a month, indistinguishable from zero (t = −0.8).
And the video’s sizing didn’t help: fixed risk per trade scored −0.26 against −0.27 for a fixed size. Across 10,000 resampled histories, fixed risk came out ahead only about half the time (p = 0.49). Equal-risk sizing trades bigger on quiet, narrow-range days, which is also where costs take the largest share of the risk.
Looking at the chart, the obvious reading is that the strategy works in some markets and not others: it lost for most of the 2010s and made money in 2019 and from 2021. The video said much the same: the Nasdaq has traded more like a trending market since 2019.
That reading was formed by looking at 2010 to 2022, so those years can’t test it. The sealed 2023 to 2026 data can. Before opening it, I wrote down three versions to test:
A regime only helps if you can recognise it at the time, and both filters use nothing but past data.
On the sealed data, the plain rule made money every year. One contract made $86,510: $26,485 in 2023, $16,060 in 2024, $29,195 in 2025 and $14,770 in 2026 up to July. Its worst drawdown was $34,100, its profit factor 1.20, and it won 57.6% of trades, close to the video’s 58%.
In returns it was genuinely good:
| 2023 to July 2026 | Sharpe after costs | 95% interval | Max drawdown |
|---|---|---|---|
| Breakout, plain rule | 1.18 | 0.56 to 1.93 | 5.9% |
| Breakout, own-track-record filter | 1.18 | 0.56 to 1.93 | 5.9% |
| Breakout, trend filter | 1.03 | 0.34 to 1.88 | 5.9% |
| Long the Nasdaq every day, 10:00 to 15:00 | 1.01 | 0.05 to 1.94 | 14.0% |
It held up at double the costs (1.07), made money in both halves of the period, and this time it was mostly not just being long: its beta was 0.19, and it earned about 38 basis points a month on top of the benchmark.
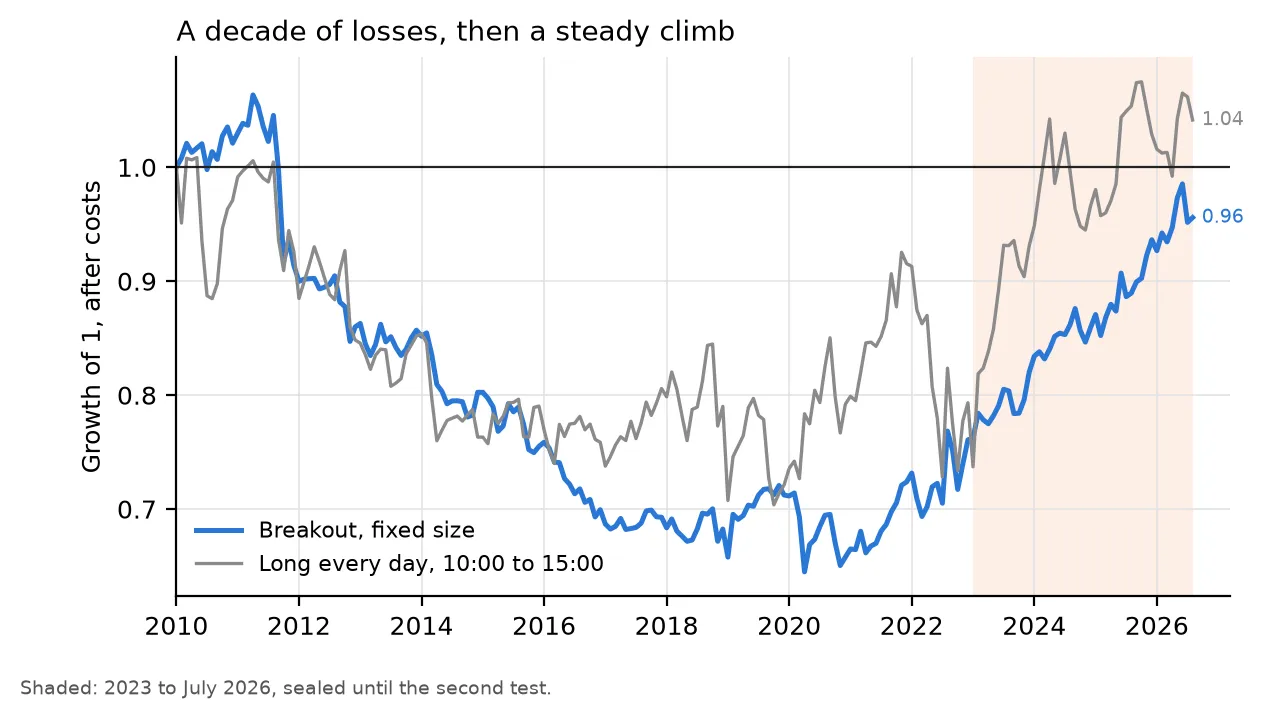
The fixed-size breakout and the benchmark in returns, after costs, over both tests.
Neither filter helped. The own-track-record filter never switched off, because at every monthly check from January 2023 the strategy had made money over the previous 12 months; it was the plain rule. The trend filter sat out 9% of days and lowered the Sharpe ratio, from 1.18 to 1.03.
So “it’s a regime strategy” is true as a description of the past. I couldn’t find a rule, fixed in advance, that would have kept you out from 2010 to 2018 and in from 2021. Across the whole of 2010 to July 2026, the breakout still ended slightly behind where it started in returns (0.96 for every 1 invested), while simply being long through the day ended at 1.04.
Two things keep me from calling this a working strategy.
First, it still failed my pass marks, narrowly on one and clearly on another. Its return on top of being long had a t-statistic of 1.94, just under the bar of 2. And after allowing for how many versions of this idea I’ve now tried (seven, counting two earlier ones on currencies and gold), 43 months of data would need a Sharpe ratio of about 1.7 to be convincing.
Second, 2023 to 2026 was sealed from me, not from the strategy’s history. The video’s author chose this strategy because it survived his tests on 2021 to 2026, which include those years. My second test confirms his result with independent code and realistic costs, but it can’t undo the fact that the strategy was picked for working in exactly that period.
The only clean test left is one on data nobody has seen yet. So I’ve frozen the rules and the code, and committed what would count as “still working” and “stopped working”. I’ll run them on November 2026 to October 2027 once that data exists, and again a year later, with no changes in between.
It shows that this breakout, run as described on the Nasdaq-100 at realistic costs, lost money from 2010 to 2018 and made money from 2021 to 2026, and that two sensible regime filters, fixed in advance, wouldn’t have told you which period you were in. It doesn’t test the delta filter, which I left out as the video did, and it says nothing about how Fabio Valentini trades: a discretionary trader reads far more context than a rule written down from a video.
The process in the video was sound: simplify, test each piece, look at sizing. The missing step was to test it in years nobody picked. Here that cut both ways: thirteen years made the strategy look worthless, and the sealed years made it look good again. Whether the recent run is a new normal or another regime that will end is what the forward test is for.
Both tests were written down and committed before they were run. One month of 2014 had no data, and QuantConnect’s data ended in July 2026; the pre-registered rules covered both. All the figures come from the committed scripts, and a separate check script compares every number in this post against their output and against the video’s transcript.