Nov 2026
Recording every new token forward, pre-registering every rule, and a real-money post-mortem that blamed the safety stops, not the strategy.
Quant, Research, Crypto, Python, Next.js
New to some of the terms? See the glossary at the end.
Smart Money Concepts are everywhere if you look at trading content online. Liquidity sweeps, fair value gaps, order blocks, the “AMD” cycle: a vocabulary, mostly from the educator known as ICT, for reading the footprints big institutions supposedly leave in price. The videos show beautiful examples. What they rarely show is what happens if you turn the idea into a fixed rule and run it over thousands of trades.
In August 2026 I did that, six times. Each rule was written down before it was tested, run over currency pairs and gold going back to 2005, and judged on years of data it hadn’t seen, after realistic trading costs. None of the six made money. The more interesting part is why, because the six failed in different ways, and one of them was pointing in the right direction all along.
This is part of the same research lab as my 56 trading hypotheses and market-timing posts, under the same rules.
Turning chart patterns into code means making choices, and SMC traders will rightly argue with some of them. So here are the choices, stated up front.
Each rule was written in a pre-registration before any backtest ran: the exact definition, the fixed settings, and what each kind of failure would mean.
1. Liquidity sweep (daily). Price trades above the highest high of the last 20 days but closes back below it, or the mirror at the lows. SMC calls that a stop hunt before a reversal, so the rule takes the other side and holds for five days.
2. Fair value gap (daily). A three-candle gap forms (the third candle’s low above the first candle’s high, or the mirror). When price comes back to the gap’s midpoint within two weeks, the rule trades in the gap’s original direction, as ICT teaches, for five days.
3. Order block (daily). A big candle, with a body more than 1.5 times the average daily range of the previous 14 days, preceded by an opposite-coloured candle. That earlier candle is the order block. When price revisits its range within two weeks, the rule trades in the big candle’s direction.
4. AMD with an inverse fair value gap (daily). A quiet two-week range (accumulation), a false break out of it (manipulation), then a gap in the reversal direction that fails, with price closing through it. The rule trades the original false break’s direction, betting the real move (distribution) has started.
5. The same AMD idea, hourly. Built on actual trading sessions: the Asian session sets the range, the London open sweeps it, a gap forms in the next few hours, and if it fails by 16:00 UTC the rule trades in the sweep’s direction for four hours.
6. AMD with the gap holding, hourly. The same set-up, but betting the reversal gap holds when price returns to its midpoint, the opposite side of the same story.
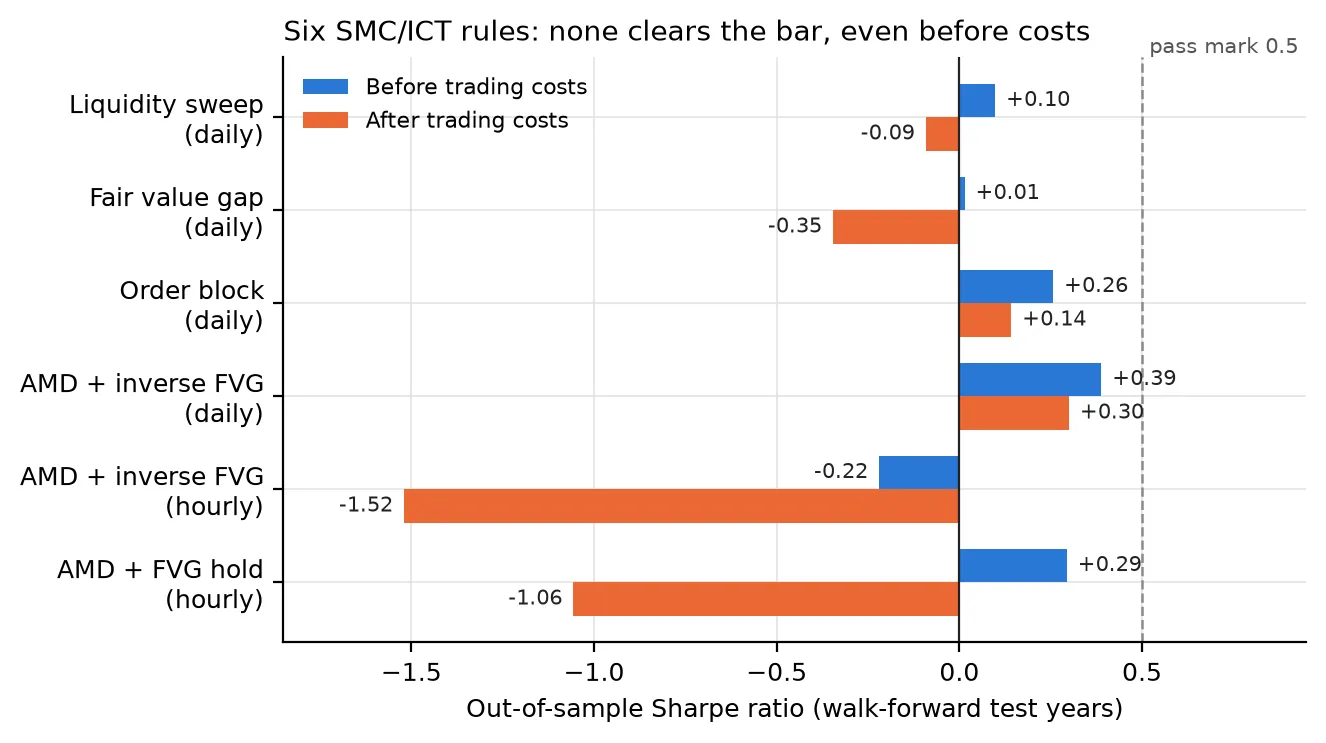
Out-of-sample Sharpe ratio for each rule, before trading costs (blue) and after (orange). The pass mark is 0.5.
| Rule | Before costs | After costs |
|---|---|---|
| Liquidity sweep (daily) | +0.10 | −0.09 |
| Fair value gap (daily) | +0.01 | −0.35 |
| Order block (daily) | +0.26 | +0.14 |
| AMD + inverse gap (daily) | +0.39 | +0.30 |
| AMD + inverse gap (hourly) | −0.22 | −1.52 |
| AMD + gap holds (hourly) | +0.29 | −1.06 |
The blue bars are the important ones. They show each rule with trading costs switched off entirely, as if trading were free, and not one reaches the pass mark even then. These aren’t good ideas ruined by costs. There was very little there to begin with, and costs turned “very little” into a loss.
The liquidity sweep was right about the direction. This is the result I didn’t expect. After a sweep, price did tend to move the way SMC says: the signal’s correlation with what happened next was positive in every kind of market I split the data into, at +0.13 to +0.18, which is strong. The trouble was size and frequency. The pattern fires rarely, the moves that follow are small, and a five-day hold collects too little of them to pay for trading. “Points the right way” and “makes money” turned out to be different claims.
The best academic evidence is more mixed than the videos suggest. Carol Osler studied the actual orders held by a large currency dealing bank (Journal of Finance, 2003). Take-profit orders clustered at round numbers, which helps explain why prices often bounce off those levels. Stop-loss orders clustered just beyond them, and when price got through, triggering those stops tended to make the move run further. So there is a real mechanism behind levels mattering, but it cuts both ways: some levels hold, and some breaks accelerate. A rule that always bets on the reversal is betting on only half of it.
The fair value gap pointed the wrong way. Once a gap had been revisited at its midpoint, price tended to keep going away from the original move, not resume it. That is the classic way a backtest fails, and the worst drawdown, 29.7%, broke the 25% limit too. What I didn’t do is flip the rule and test that instead. Testing the opposite of a failed idea on the same data is a quiet way to manufacture a winner, so a reversed fair value gap would need its own pre-registration and its own fresh test.
The order block depended on its settings. It made a small profit before costs, but nudging its settings, how big a “big candle” has to be, or how long to wait for the revisit, changed the result sharply. A real effect shouldn’t fall off a cliff when you move a threshold a little. There is also a known complication: research on large price moves in US stocks (Pavel Savor, Journal of Financial Economics, 2012) found that moves accompanied by news, measured by analyst reports, tend to continue, while moves without news tend to reverse. An order-block rule treats every big candle the same, and price charts can’t tell you which kind it was.
The AMD rule was the closest, and still only worked in one kind of market. At +0.30 after costs it came nearest to the bar, but nearly all of its edge came from volatile markets. In trending and ranging conditions it pointed the wrong way.
The two hourly rules are the cleanest result here, because they are opposite bets on the same set-up. One says the reversal gap fails and the original move resumes; the other says the gap holds. They aren’t exact mirror images, but if the set-up carried real information, at least one of them should have shown an edge before costs.
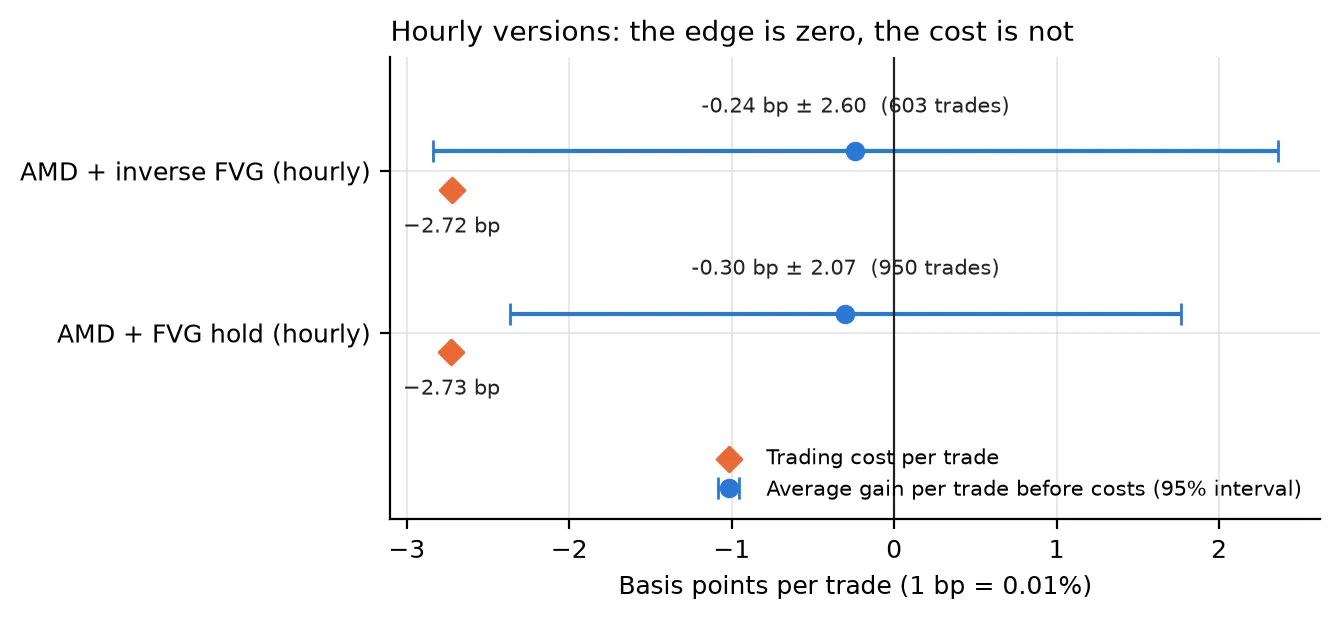
Average gain per trade before costs, with a 95% interval, against the cost of each trade.
Neither did. The first rule’s trades won 50.6% of the time before costs; the second’s won 49.7%. The average trade made −0.24 and −0.30 basis points before costs, and in both cases the 95% interval around that (±2.6 and ±2.1) comfortably includes zero. Costs averaged 2.7 basis points a trade, and unlike the edge, they were certain. A coin flip that pays a fee on every toss loses money, and that is what both rules did: −1.52 and −1.06 after costs, over 603 and 950 trades.
The order in which these were tested matters too. The “gap fails” rule was tested first and lost badly. Rather than flip its sign and declare victory, the opposite version was written up as a separate hypothesis before it was run. It lost as well, which is the answer you’d expect if the set-up simply doesn’t predict anything on hourly bars.
One more thing worth telling. The first version of the daily AMD rule defined a “quiet range” by comparing a ten-day price range with a one-day average range, a units mistake that made the condition almost impossible to meet. It fired on 2 days out of 5,631. That was caught before any result was seen, because the pre-registration required counting how often each rule fires before judging whether it works. Fixed, it fired normally, and then failed on its merits. A rule that never trades can’t fail a backtest, and it can’t teach you anything either.
It shows that these six specific, written-down rules had no tradeable edge in the major currency pairs and gold from 2005 to 2022, after realistic costs, on data they weren’t tuned on. It doesn’t show that no one can make money with Smart Money Concepts. Most SMC traders would say the concepts need judgement, context and higher-timeframe confirmation that no single rule captures, and some of that may be true.
But it does put a burden on that claim. If an idea only works when a person applies it, and fails every time it’s written down precisely enough to test, the honest conclusion is that the evidence lives in the person’s judgement, not in the pattern. That can be tested too, by keeping a written record of every trade before the outcome is known, and it is the test I would want to see before paying for a course.
The six rules were tested between 13 and 18 August 2026. For this post, in October, I reran all six from scratch: re-downloaded the price history, ran each one through the lab’s own backtest code, and compared the results with the research registry’s records. All six matched to two decimal places. The “before costs” numbers are the same code with costs set to zero.